14 interconnected worksheets. 57,000+ transaction rows. Journal entries flow automatically into the income statement, balance sheet, and both direct and indirect cash flow statements with built-in reconciliation proving they match. Built from 15 years of corporate controlling at Dufry Group and Bomi (UPS Group).
Every worksheet shown here is from the actual file. No mockups.
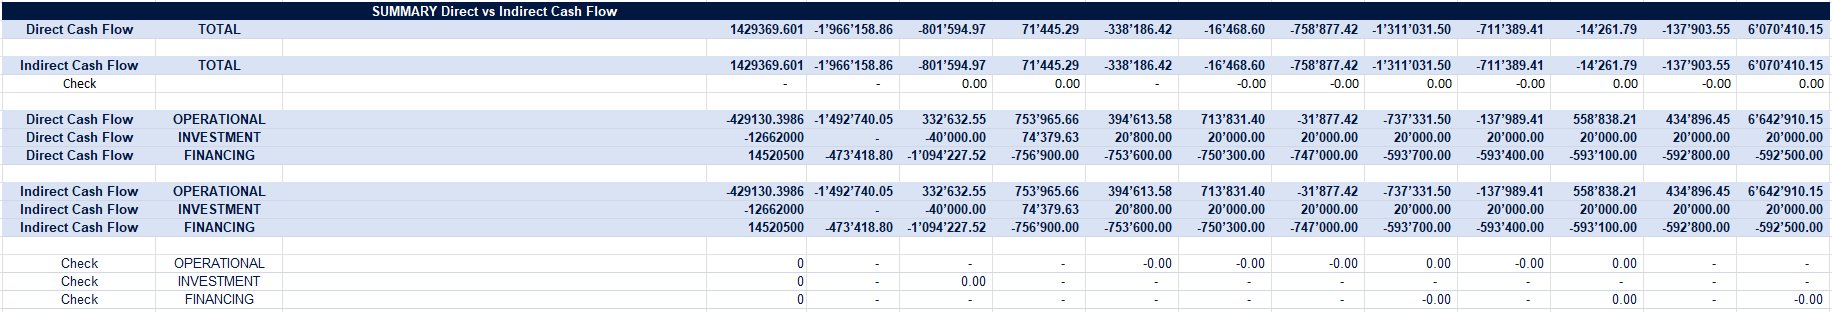
The reconciliation worksheet proves both methods match across all 12 months, broken down by operational, investment, and financing activities. Every check row reads 0.00. This is the single most important worksheet in the model.
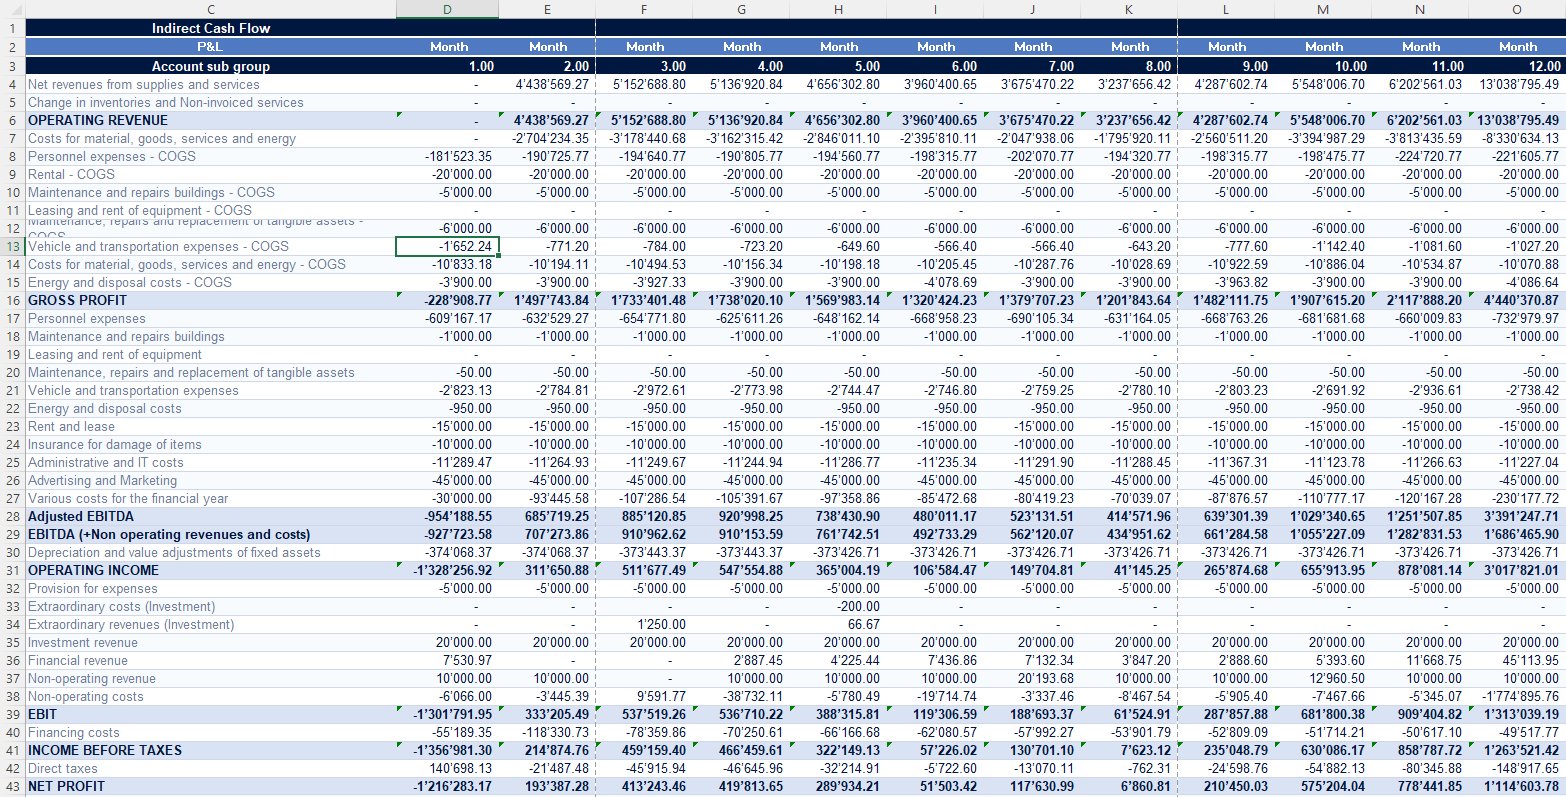
Full P&L with COGS and OPEX separated throughout. Six profitability subtotals: Gross Profit, Adjusted EBITDA, EBITDA, Operating Income, EBIT, and Net Profit. Flows automatically from journal entries, updated every month.
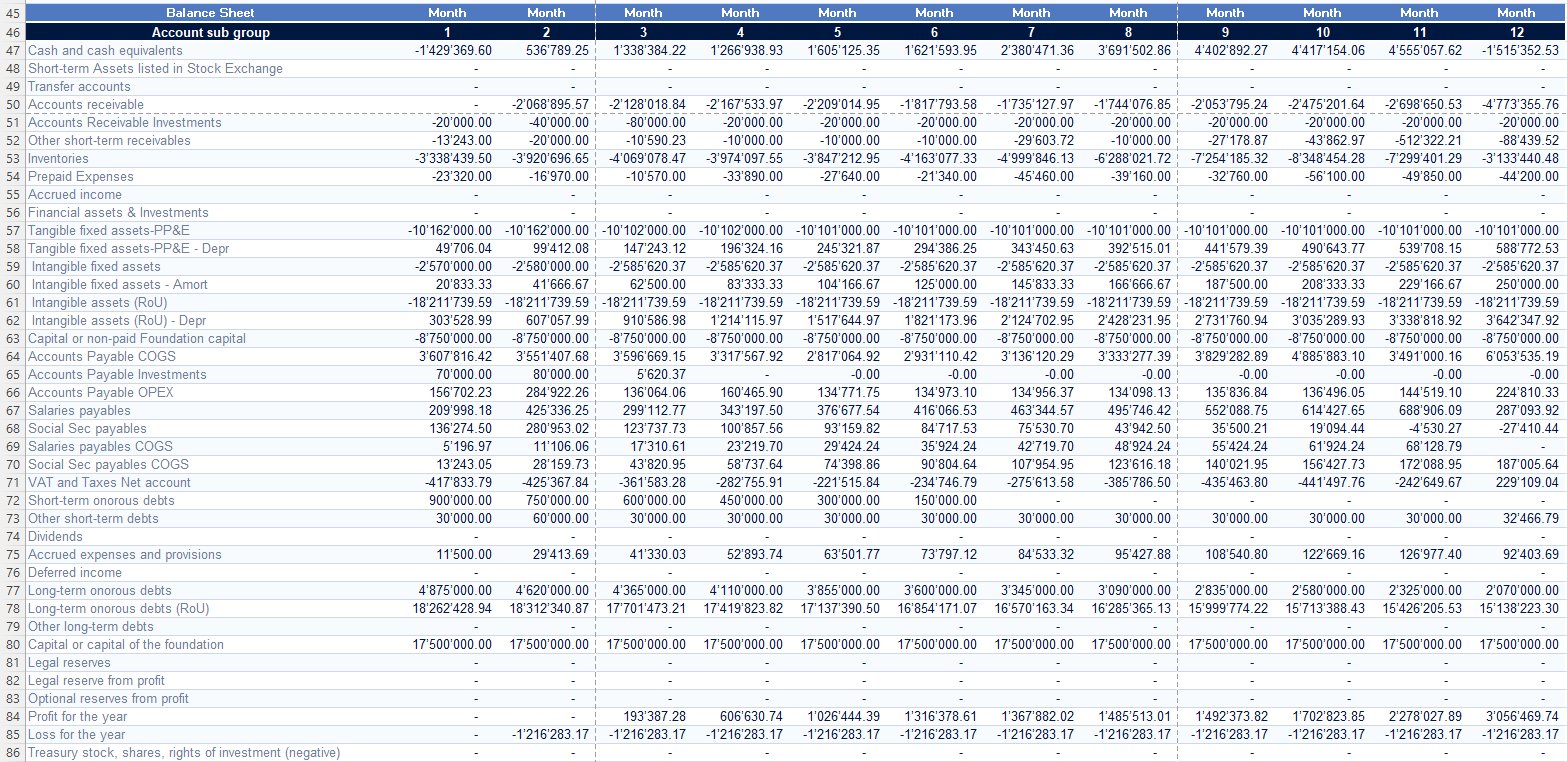
Complete balance sheet updated monthly. Includes right-of-use assets and lease liabilities (IFRS 16), separate payables for COGS, OPEX, and investments, and full equity section with retained earnings tracking.
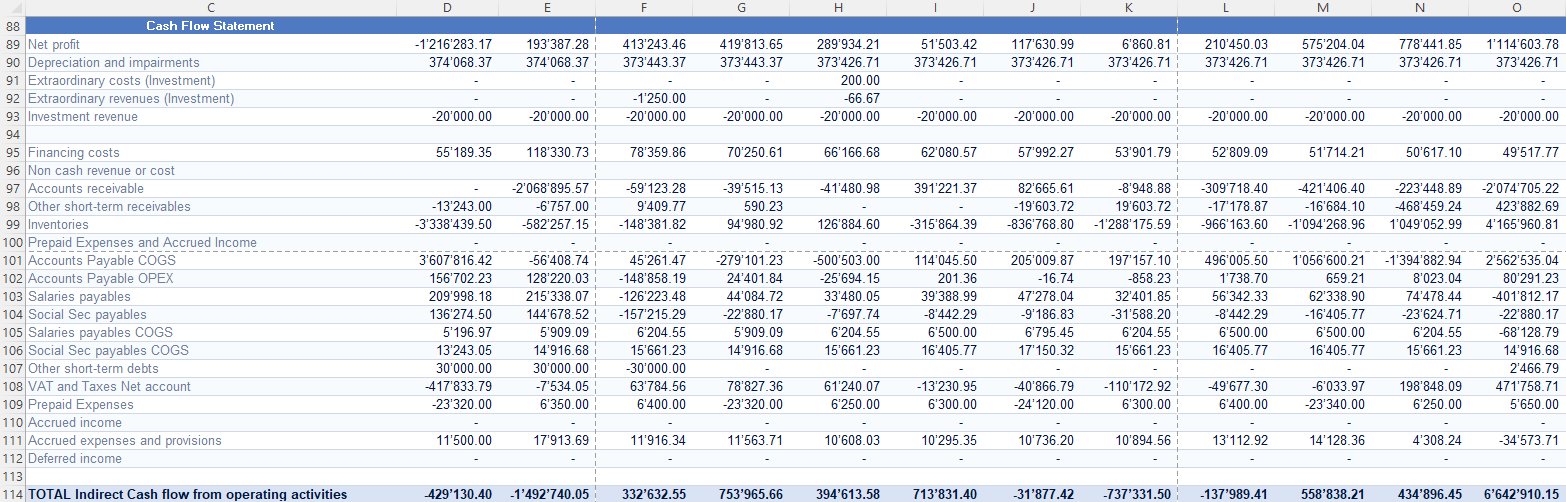
Net profit adjusted for non-cash items: depreciation, working capital movements, inventory changes, payables, receivables, accruals. Every line sourced directly from the balance sheet and P&L. Nothing is manual.
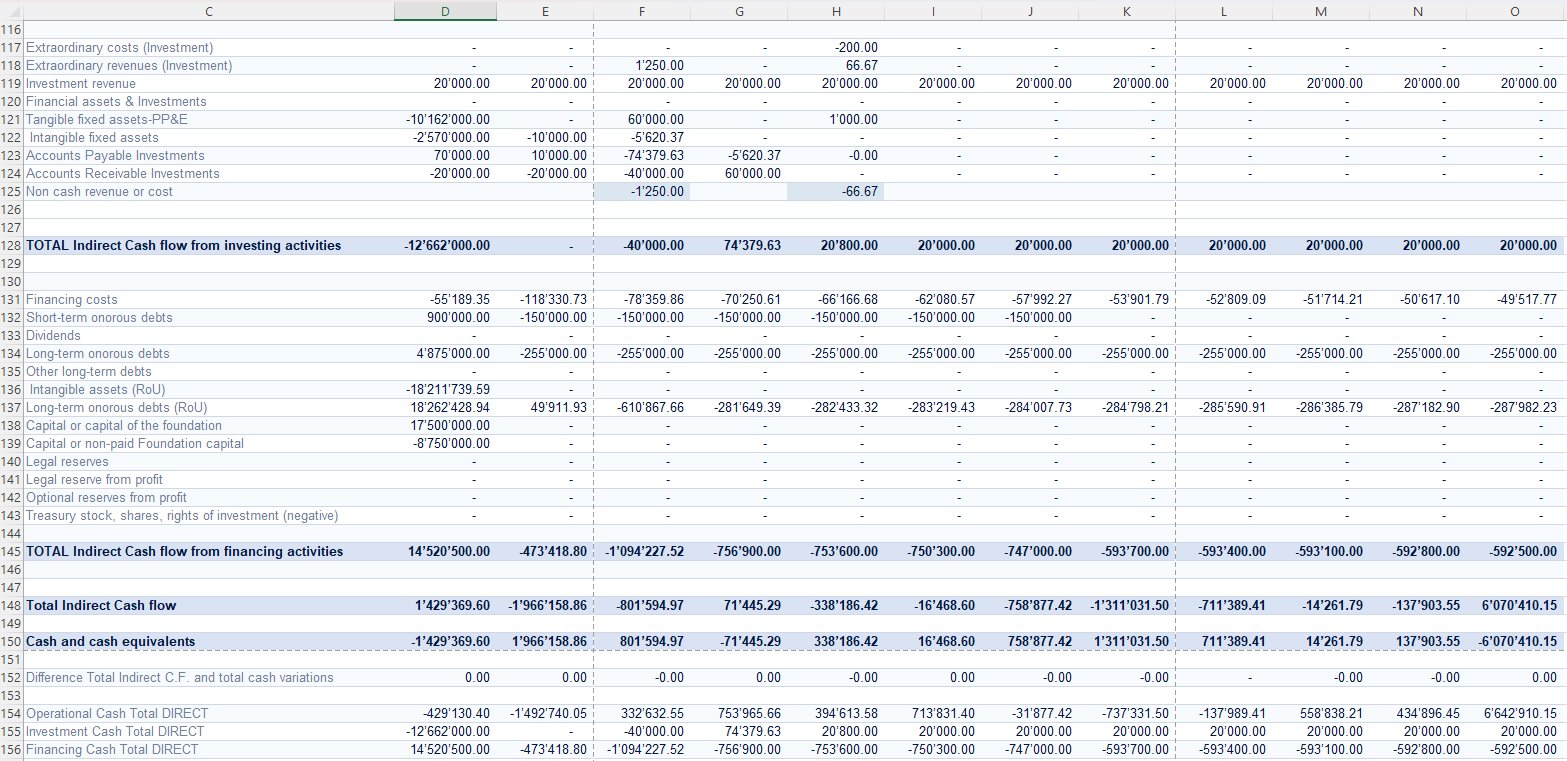
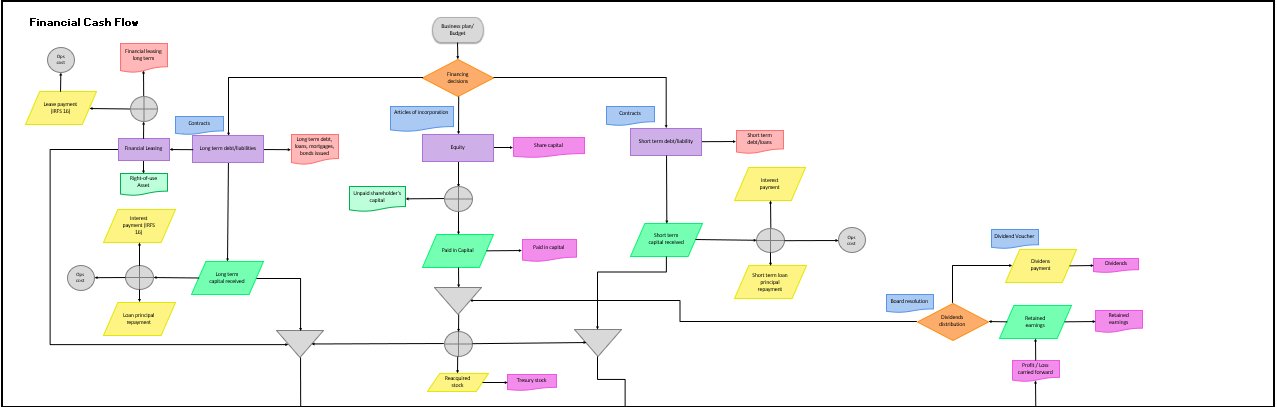
Capital expenditure, intangible assets, long-term debt movements, IFRS 16 lease liabilities, dividends, and equity changes. Fully integrated with the balance sheet so every movement is traceable.
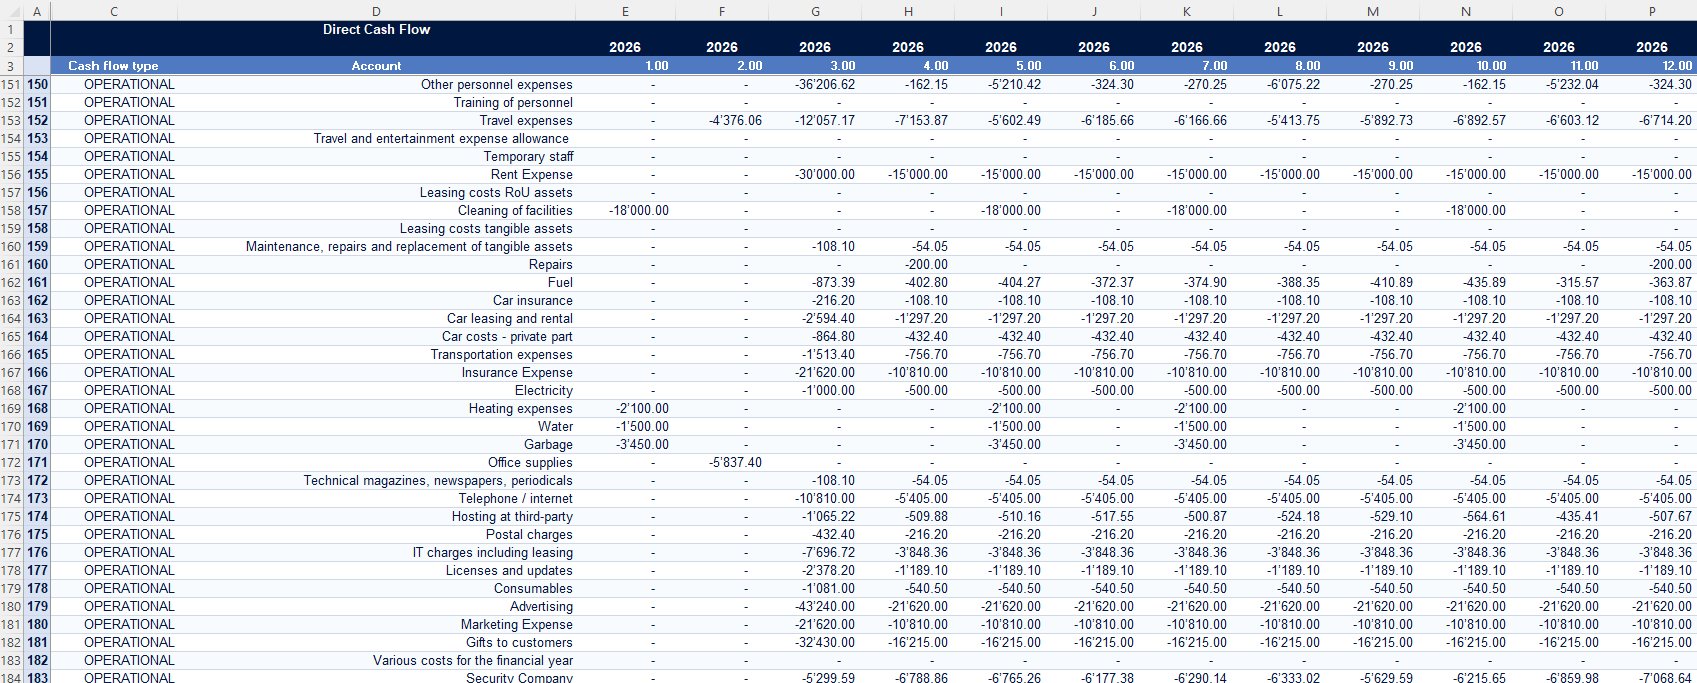
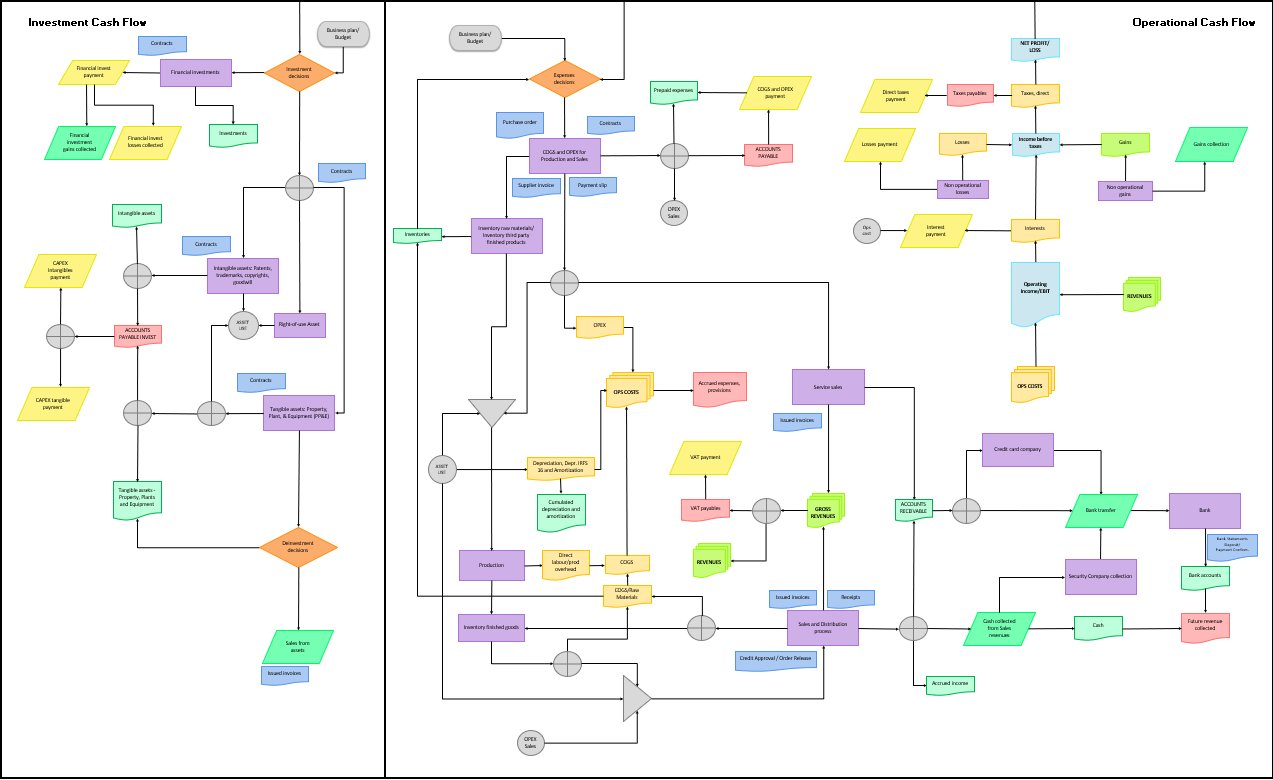
Every actual cash movement classified by type (operational, investment, financing) at individual account level across all 12 months. Built directly from journal entries, not derived from the P&L. Shows exactly which expenses consumed cash and when: the granularity the indirect method abstracts away. Reconciles automatically to the indirect method with zero variance.
If you're a controller or CFO, you've probably built or inherited dozens of financial models in Excel. Some work. Most are held together with manual overrides, broken links, and formulas nobody dares touch.
This model is different. It's the end-to-end financial cycle in a single file: journal entries flowing through to a full P&L, balance sheet, and both direct and indirect cash flow statements automatically, with zero manual adjustments. Change a journal entry and watch the impact cascade through every statement.
It also bridges the gap that most models ignore: the space between accounting (journal entries, ledgers, trial balance) and controlling (COGS calculation, inventory movements, cost center allocation, profitability subtotals). That bridge is where controllers actually live, and where most Excel models fall apart.
I built this from 15 years of running controlling operations at Dufry Group and Bomi (UPS Group). Every worksheet, every flow, every reconciliation mirrors how I actually structured reporting in a multi-million CHF operation.
This is not an introductory accounting tool. It assumes you understand double-entry bookkeeping, can read financial statements, and know the difference between direct and indirect cash flow methods. What it gives you is something harder to find: a complete, working reference model that does the full cycle properly.
If you're setting up financial reporting from scratch or inheriting a mess, this gives you a proven structure to work from. Chart of accounts, P&L layout, balance sheet groupings, cash flow reconciliation logic. Adapt it and have a professional reporting framework in days, not months.
Your ERP produces reports, but can you trace a single transaction from journal entry through to its cash flow impact? This model lets you build that visibility outside the ERP, for validation, for scenario testing, or for when the system output doesn't add up and you need to find out why.
Before you configure your ERP, prototype it here. Test whether your account structure supports the profitability subtotals you need. Verify that your cash flow statement will reconcile. Cheaper to find structural problems in Excel than in SAP.
The direct-vs-indirect reconciliation, the built-in balance checks, the full trail from journal entry to financial statement: this is the level of documentation and traceability that auditors want to see. Use this as a reference for how your own reporting should work.
If you're comparing what your ERP can produce against what a properly structured financial model should produce, this is your benchmark. If your ERP can't do what this Excel file does, you have a configuration problem.
Map the chart of accounts to your organization. Replace the sample journal entries with your actual data: feed journal entries directly, import bank statement data, or pass in your existing income statement and balance sheet figures. The formulas do the rest. You'll have a complete set of financial statements including fully reconciled cash flow within hours.
Run your ERP output alongside this model. Feed the same data into both. If the cash flow statements don't match, one of you has a structural problem: and this model makes it easy to find where the discrepancy originates, because every number traces back to a journal entry.
Before committing to a new chart of accounts, reporting structure, or cash flow methodology in your ERP, build it here first. Test the account groupings, verify the cash flow reconciliation logic, check whether your profitability subtotals (Gross Profit, EBITDA, Operating Income, EBIT) work with your cost structure. Iterate in Excel, then implement in your system with confidence.
Most financial models solve one part of the problem. This one solves all of it.
Not a reporting template. Not a budget model. A complete accounting cycle that produces all three financial statements from a single data source. Change one entry, see the impact everywhere.
The summary worksheet proves they match across all 12 months, broken down by operational, investment, and financing activities. 0.00 variance, every period. This is the level of rigor a Big Four audit team expects, and almost nobody builds in Excel.
COGS vs. OPEX separation throughout the P&L and balance sheet. Inventory movements (raw materials to finished goods). Separate payables tracking for COGS, OPEX, and investment. Six profitability subtotals. This model doesn't just close the books: it produces the management reporting a controller needs to run the business.
Right-of-use assets, lease liabilities, and their depreciation/amortization flow through the balance sheet and cash flow statement. Not bolted on as an afterthought: integrated into the core model structure.
Two detailed diagrams mapping every transaction type (operational, investment, and financing) from source document to cash flow impact. A powerful tool for explaining your reporting logic to auditors, boards, or new team members.
This structure comes from 15 years of controlling at Dufry Group and Bomi (UPS Group), not from a textbook. Every design choice reflects what actually works under pressure, with real deadlines and real auditors.
Two A3-ready diagrams included with every purchase. They map every transaction type from source document to cash flow impact. Use them to explain your reporting logic to auditors, boards, or new team members.
Maps every operational transaction from purchase order through to accounts payable, inventory movements, COGS, and revenue collection. The investment side covers CAPEX, intangible assets, PP&E, and divestment decisions. Every node traces to a specific journal entry in the model.
Covers all financing decisions: long-term debt and loans, equity issuance and treasury stock, short-term borrowings, IFRS 16 lease liabilities, interest payments, dividends, and retained earnings. Includes the full IFRS 16 treatment from lease contract through to right-of-use asset and cash flow impact.